Sunday, September 7, 2008

poster... huhu


my sketch for the poster.


after got my overall idea, now i can start with tracing my sketches. i use pen tools to trace up the sketches. started with the first picture, the world still have ice save for the animals.


after finish the first sketch on the first picture, lets do the second picture, still using the pen tool. for the 2nd picture is about the world have lost the ice.


it is time to play with colors. for the ice i add blueish and the orange is for the sky. i use gradient tool to mixed up the color. and i use some blur effect.


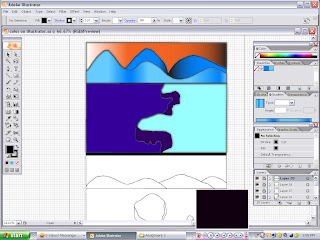
same goes to the ice and the ocean, by using gradient and blur tool. finish my first picture. lets start the 2nd picture..


same as the 1st picture, i still use gradient tool to mixed up colors and blur tool. next step, think for the caption!.


slogan : SAVE WORLD, SAVE ICE. means, if you want to save the world for not covered up 100% with water, then you must save the ice first before its melting so that the level of water will not increased.


my poster..! =)

refferences for the poster

my refferences... =)


just a poster for my final idea..


dimensions of water..


sea water and the stone that i see like an ice caps.


dozens of ice... :)


url :

www.yahoo.com
www.google.com

Saturday, August 16, 2008

Ice caps


Ice loss from glaciers and ice caps is expected to cause more global sea rise during this century than the massive Greenland and Antarctic ice sheets, according to a new University of Colorado at Boulder study.
The researchers found that glaciers and ice caps are currently contributing about 60 percent of the world’s ice to the oceans and the rate has been markedly accelerating in the past decade. The contribution is presently about 100 cubic miles of ice annually — a volume nearly equal to the water in Lake Erie — and is rising by about three cubic miles per year.
In contrast, the CU-Boulder team estimated Greenland is now contributing about 28 percent of the total global sea rise from ice loss and Antarctica is contributing about 12 percent. Greenland is not expected to catch up to glaciers and ice caps in terms of sea-level rise contributions until the end of the century.
“One reason for this study is the widely held view that the Greenland and Antarctic ice sheets will be the principal causes of sea-level rise,” said Meier, former
INSTAAR director and professor in geological sciences. “But we show that it is the glaciers and ice caps, not the two large ice sheets, that will be the big players in sea rise for at least the next few generations.”
The rise in contribution is due in part to the fact that glaciers that reach the ocean seem to be dumping ice at a faster rate, in essence “emptying out” faster. Many tidewater glaciers are undergoing rapid thinning, stretching and retreat, which causes them to speed up and deliver increased amounts of ice into the world’s oceans, said CU-Boulder geological sciences Professor Robert Anderson, study co-author.
Water controls how rapidly glaciers slide along their beds, Anderson said. When a glacier with its “toe in the water” thins, a larger fraction of its weight is supported by water and it slides faster and calves more ice into the ocean at the glacier terminus.
“While this is a dynamic, complex process and does not seem to be a direct result of climate warming, it is likely that climate acts as a trigger to set off this dramatic response,” said Anderson, also an INSTAAR researcher.
Alaska’s Columbia Glacier, which is now discharging about two cubic miles of ice annually into Prince William Sound, is a good example, according Anderson. The Columbia Glacier, which has thinned up to 1,300 feet in places, has shrunk by about nine miles since 1980 and is expected to shrink by another nine miles in the next two decades.
The team estimated that the accelerating melt of glaciers and ice caps could add from four inches to 9.5 inches of additional sea-level rise globally by 2100. This does not include the expansion of warming ocean water, which could potentially double those numbers. A one-foot sea-level rise typically causes a shoreline retreat of 100 feet or more, and about 100 million people now live within about three feet of sea level.
“At the very least, our projections indicate that future sea-level rise may be larger than anticipated, and that the component due to glaciers and ice caps will continue to be substantial,” wrote the researchers in Science Express.
The team summarized satellite, aircraft and ground-based data from glaciers, ice caps, the Greenland ice sheet, the West Antarctic ice sheet and the East Antarctic ice sheet to calculate present and future rates of ice loss for the study. The study was funded primarily by the National Science Foundation and NASA.
Meier estimated there are several hundred thousand small glaciers and small, pancake-shaped ice caps in polar and temperate regions. They range from modest, high mountain glaciers to huge glaciers like the Bering Glacier in Alaska, which measures about 5,000 square miles in area and is nearly one-half mile thick in places.
The researchers used a mathematical “scaling” process to estimate more remote glacier volumes, thicknesses and trends by factoring in data like altitude, climate and geography. They used data gathered from around the world, including cold regions in Russia, Europe, China, Central Asia, Canada and South America.
While warming temperatures will likely cause many small high mountain glaciers in North America and Europe to disappear by the end of the century, large ice fields and ice caps will continue to produce large amounts of meltwater, Meier said. The scientists also believe many “cold” polar glaciers and ice caps will soon warm up enough to begin melting and contributing to sea rise.
The retreat of the Greenland and Antarctic ice sheets also is giving birth to new, smaller glaciers that are prime candidates for study by scientists. “It is incorrect to assume that the small glaciers will simply go away next century — they will continue to play a key role in the sea level story,” said Anderson.
Anderson also said that although the volume of ice locked up in Greenland is equal to roughly 23 feet in sea rise, only a small fraction is likely to be “pulled out” during the next century, most of it through outlet glaciers.
Many smaller “benchmark” glaciers around the world that have been under study for decades are expected to disappear by the end of the century, said Anderson. “We need to start gathering benchmark information on some of the larger glaciers that are unlikely to disappear, so that we can have a long-term record of their behavior.”
Anderson said outlet glaciers in Greenland behave much like tidewater glaciers in Canada and Alaska, making them very relevant for long-term study. “Since the world is becoming increasingly aware that sea-level rise is a very real problem, we need to acknowledge the role of all of the ice masses and understand the physical mechanisms by which they deliver water to the sea.”


A United Nations panel issued its strongest warning yet on Monday saying that more natural disasters, hunger in Africa, rising seas could happen, and called on governments to act now.
The report, compiled by hundreds of countries, said that warming caused by humans emitting high levels of green house gases would lead to desertification and rising sea levels that would hit hard in the tropics from sub-Saharan Africa to the Pacific islands.
“It's the poorest of the poor in the world, and this includes poor people even in prosperous societies, who are going to be the worst hit. This does become a global responsibility in my view,” said Rajendra Pachauri the chairman of the Intergovernmental Panel on Climate Change (IPCC).
The IPCC groups 2,500 scientists together that make up the world’s authority on climate change. The IPCC said that all regions of the world would suffer from sharp changes in the climate.
The IPCC’s findings are approved by governments and guide policy for things such as the Kyoto Protocol which is the United Nation’s plan for capping greenhouse emissions beyond 2012.
The Bush administration pulled the United States out of the Kyoto meetings in 2001 because they believed they should be able to set their own guidelines and that these were too strict.
"Each nation sort of defines their regulatory objectives in different ways to achieve the greenhouse reduction outcome that they seek," Jim Connaughton, chairman of the White House council on environmental quality, told reporters.
Others on Capital Hill see the report as a call to action on global warming. “This Congress must rise to the challenge of transitioning from energy sources that threaten the planet and preparing for the damage we can no longer avoid,” said Rep. Edward Markey, who heads a special committee on energy independence and global warming in the House.
The report warned that rising green house gases could cause diminished crop yield in Africa causing hunger for millions. It could cause rapid thawing of the Himalayan glaciers that feed rivers into India and China. It also could cause heat waves in Europe and North America.
The report also warned that the rapid climate changes could cause species extinctions as their food source becomes unavailable or habitat changes due to warming. There are many factors involved in a changing climate that can have an impact on the animal population.
“This further underlines both how urgent it is to reach global agreement on reducing greenhouse gas emissions and how important it is for us all to adapt to the climate change that is already under way,” said European Environment Commissioner Stavros Dimas.
China, Saudi Arabia, and Russia were quick to try and downplay the findings and the United States objected to language being added to the report saying that parts of North America could suffer “severe economic damage” from global warming, which was the reason they left the Kyoto meetings in 2001.

Final Assignment 2


My final design for the second assignment.
Melting of ice caps.
I choose this design to show the new detail of my first assignment.
This is because the ice now were melting more and more because of the global warming.
Darker Grey : Represented the color of the ocean
Blue : Mount of ice and sky
White : Ice caps
Lighter Grey : The shadow of ice caps

second assigment

Step 8

Step 6
Step 5

Step 4


Step 4


Step 3


Step 2


Step 1


Wednesday, July 23, 2008

ozone ~


The ozone layer is a layer in Earth's atmosphere which contains relatively high concentrations of ozone (O3). This layer absorbs 93-99% of the sun's high frequency ultraviolet light, which is potentially damaging to life on earth.[1] Over 91% of ozone in earth's atmosphere is present here.[1] "Relatively high" means a few parts per million—much higher than the concentrations in the lower atmosphere but still small compared to the main components of the atmosphere. It is mainly located in the lower portion of the stratosphere from approximately 10 km to 50 km above Earth's surface, though the thickness varies seasonally and geographically.[2] The ozone layer was discovered in 1913 by the French physicists Charles Fabry and Henri Buisson. Its properties were explored in detail by the British meteorologist G. M. B. Dobson, who developed a simple spectrophotometer that could be used to measure stratospheric ozone from the ground. Between 1928 and 1958 Dobson established a worldwide network of ozone monitoring stations which continues to operate today(2008). The "Dobson unit", a convenient measure of the total amount of ozone in a column overhead, is named in his honor.

Origin of ozone

Ozone-oxygen cycle in the ozone layer.
The photochemical mechanisms that give rise to the ozone layer were worked out by the British physicist
Sidney Chapman in 1930. Ozone in the earth's stratosphere is created by ultraviolet light striking oxygen molecules containing two oxygen atoms (O2), splitting them into individual oxygen atoms (atomic oxygen); the atomic oxygen then combines with unbroken O2 to create ozone, O3. The ozone molecule is also unstable (although, in the stratosphere, long-lived) and when ultraviolet light hits ozone it splits into a molecule of O2 and an atom of atomic oxygen, a continuing process called the ozone-oxygen cycle, thus creating an ozone layer in the stratosphere, the region from about 10 to 50 km (32,000 to 164,000 feet) above Earth's surface. About 90% of the ozone in our atmosphere is contained in the stratosphere. Ozone concentrations are greatest between about 20 and 40 km, where they range from about 2 to 8 parts per million. If all of the ozone were compressed to the pressure of the air at sea level, it would be only a few millimeters thick.
Ten percent of the ozone in the atmosphere is contained in the
troposphere, the lowest part of our atmosphere where all of our weather takes place. Tropospheric ozone has two sources: about 10 % is transported down from the stratosphere while the remainder is created in smaller amounts through different mechanisms.

Origin of Ozone


Ultraviolet light and ozone

Levels of ozone at various altitudes and blocking of ultraviolet radiation.
Although the concentration of the ozone in the ozone layer is very small, it is vitally important to life because it absorbs biologically harmful ultraviolet (UV) radiation emitted from the Sun. UV radiation is divided into three categories, based on its wavelength; these are referred to as UV-A, UV-B, and UV-C. UV-C, which would be very harmful to humans, is entirely screened out by ozone at around 35 km altitude. UV-B radiation can be harmful to the skin and is the main cause of
sunburn; excessive exposure can also cause genetic damage, as a result problems such as skin cancer. The ozone layer is very effective at screening out UV-B; for radiation with a wavelength of 290 nm, the intensity at Earth's surface is 350 billion times weaker than at the top of the atmosphere. Nevertheless, some UV-B reaches the surface. Most UV-A reaches the surface; this radiation is significantly less harmful, although it can potentially cause genetic damage.
Depletion of the ozone layer allows more of the UV radiation, and particularly the more harmful wavelengths, to reach the surface, causing increased genetic damage to living creatures and organisms.


DNA sensitivity to UV

UV energy levels at several altitudes. Blue line shows DNA sensitivity. Red line shows surface energy level with 10% decrease in ozone.
To appreciate the importance of this ultraviolet radiation screening, we can consider a characteristic of radiation damage called an
action spectrum. An action spectrum gives us a measure of the relative effectiveness of radiation in generating a certain biological response over a range of wavelengths. This response might be erythema (sunburn), changes in plant growth, or changes in molecular DNA. Certain wavelengths of UV radiation have a much greater probability of DNA damage than others. Fortunately, where DNA is easily damaged, such as by wavelengths shorter than 290 nm, ozone strongly absorbs UV. At the longer wavelengths where ozone absorbs weakly, DNA damage is less likely.


Distribution of ozone in the stratosphere

Global monthly average total ozone amount
The thickness of the ozone layer—that is, the total amount of ozone in a column overhead—varies by a large factor worldwide, being in general smaller near the equator and larger as one moves towards the poles. It also varies with season, being in general thicker during the spring and thinner during the autumn. The reasons for this latitude and seasonal dependence are complicated, involving atmospheric circulation patterns as well as solar intensity.
Since stratospheric ozone is produced by solar UV radiation, one might expect to find the highest ozone levels over the tropics and the lowest over polar regions. The same argument would lead one to expect the highest ozone levels in the summer and the lowest in the winter. The observed behavior is very different: most of the ozone is found in the mid-to-high latitudes of the northern and southern hemispheres, and the highest levels are found in the spring, not summer, and the lowest in the autumn, not winter. During winter, the ozone layer actually increases in depth. This puzzle is explained by the prevailing stratospheric wind patterns, known as the
Brewer-Dobson circulation. While most of the ozone is indeed created over the tropics, the stratospheric circulation then transports it poleward and downward to the lower stratosphere of the high latitudes.

Brewer-Dobson circulation in the ozone layer.
The ozone layer is higher in altitude in the tropics, and lower in altitude in the extratropics, especially in the polar regions. This altitude variation of ozone results from the slow circulation that lifts the ozone-poor air out of the troposphere into the stratosphere. As this air slowly rises in the tropics, ozone is produced by the overhead sun which photolyzes oxygen molecules. As this slow circulation bends towards the mid-latitudes, it carries the ozone-rich air from the tropical middle stratosphere to the mid-and-high latitudes lower stratosphere. The high ozone concentrations at high latitudes are due to the accumulation of ozone at lower altitudes.
The Brewer-Dobson circulation moves very slowly. The time needed to lift an air parcel from the tropical tropopause near 16 km (50,000 ft) to 20 km is about 4-5 months (about 30 feet (9.1 m) per day). Even though ozone in the lower tropical stratosphere is produced at a very slow rate, the lifting circulation is so slow that ozone can build up to relatively high levels by the time it reaches 26 km.
Ozone amounts over the continental
United States (25°N to 49°N) are highest in the northern spring (April and May). These ozone amounts fall over the course of the summer to their lowest amounts in October, and then rise again over the course of the winter. Again, wind transport of ozone is principally responsible for the seasonal evolution of these higher latitude ozone patterns.
The total column amount of ozone generally increases as we move from the tropics to higher latitudes in both hemispheres. However, the overall column amounts are greater in the northern hemisphere high latitudes than in the southern hemisphere high latitudes. In addition, while the highest amounts of column ozone over the Arctic occur in the northern spring (March-April), the opposite is true over the Antarctic, where the lowest amounts of column ozone occur in the southern spring (September-October). Indeed, the highest amounts of column ozone anywhere in the world are found over the Arctic region during the northern spring period of March and April. The amounts then decrease over the course of the northern summer. Meanwhile, the lowest amounts of column ozone anywhere in the world are found over the Antarctic in the southern spring period of September and October, owing to the
ozone hole phenomenon.
Source : wikipedia and pictures from yahoo!

Sunday, July 20, 2008

Symbol global warming

First sketch.
This is my first sketch on my symbol of global warming..
i uses the ice to show the ice is now melting for the causes of global warming by heating up the temperature in the earth. the round shape symbolise to ozone layer.


Second sketch.
The round shape symbolized to the ozone layer of earth.
The sketch flaming fire symbolized the sun heating up the temperature of earth.


Third sketch.
The combination of ice and sun through ozone layer and the arrow stands for the movement of cfc effects of thickness of ozone layer.


First drawing in illustration. I use pen tool to shape it.


I use the paint tool to color the orange, red of sun to tells it heating up the temperature of earth.

Then, i put some blue color to represent the sea


New color blue at the bottom of ice to show the ice were melting.


The ice cube aslo blue for the transformed of the color of sea water


Black arrow for showing the movement of cfc form ozone layer and to the melting of ice cube


Lastly, here's my symbol for the global warming.